


The Egyptian economy has been on a long path to recovery since 2020 following a severe economic shock considered the deepest locally since the 1980s; a shock that came as result of the economy’s sources of revenue being badly hit and its expenses reaching an all-time high as a consequence of the unrelenting pressures experienced in the aftermath of the political insecurity and unrest during the period from 2011 to 2014.
However, the recovery has been stagnated with the outbreak of COVID-19 as well as other crises that hit simultaneously, including the US-China trade war, the catastrophic decline in emerging markets (particularly the markets of Turkey and Argentina), the turmoil in Hong Kong and the fears of the rift between China and the West being deepened, all leaving the economy strung-out.
The blow to Egypt’s economy was probably magnified by the fact the economy’s structures are still rentier-dependent rather than production-dependent. In a previous article, we shed light on the overall status of Egypt’s exports and showed the sharp decline it suffered relative to global exports besides its Achilles’ heel of being centered around raw materials and less technology-dependent industries. Indeed, such decline came with the territory as has been suggested in another article that made it clear that the industrial sector in Egypt isn’t in its finest hour.
This article highlights the status of Egypt’s industrial exports in terms of exports landscape and potential markets, aiming to give an answer to questions like: What are Egypt’s most exported industrial commodities? Which commodities will be able to maintain their share in global markets? And which ones have risen in the past 10 years?
First: Egypt’s major industrial exports
From 2008 to 2019, Egypt’s top 15 manufactured exports were mainly concentrated in less technology-dependent, low-complexity industries, including iron and steel, fertilizers, plastics, and paper, among others. As is seen from Figure 1, in 2019, the total exports of the top 15 exported commodities showed an increasing trend reaching a high of $18.37 billion compared to $11.04 billion in 2008, hence indicating an overall growth as the below figure illustrates:
Figure 1: Growth rates of Egypt’s top 15 manufactured commodities (US$ million), 2008-2019
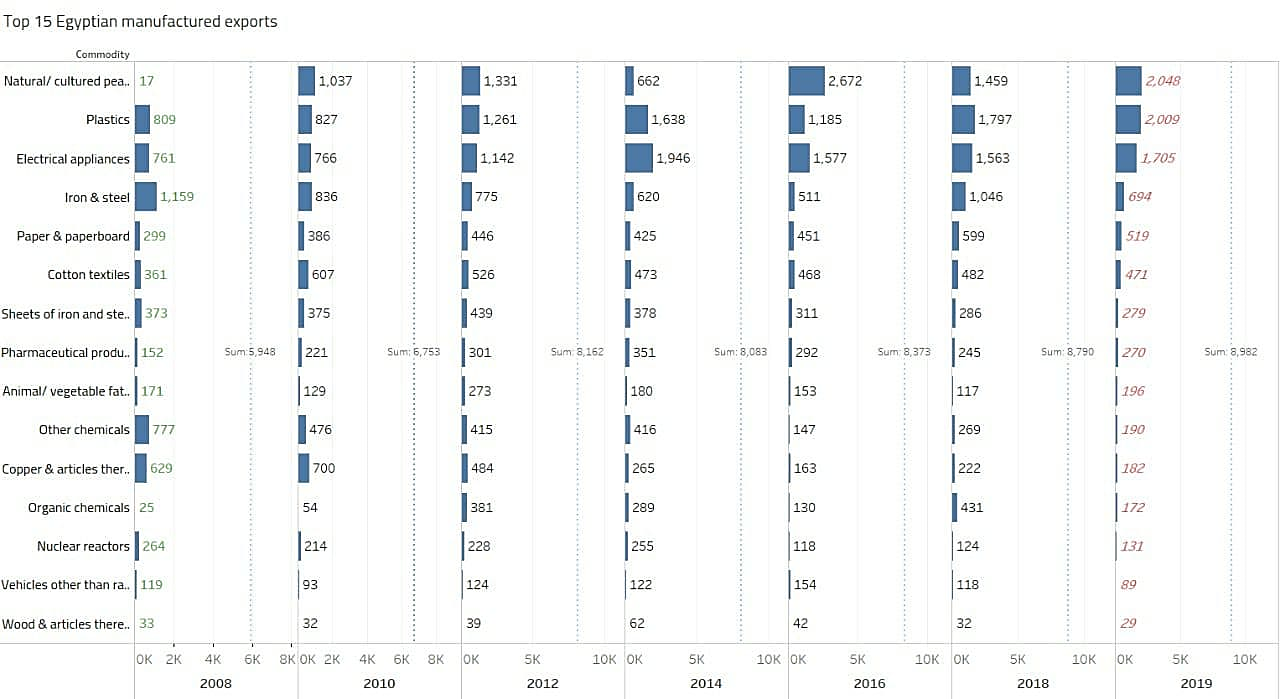
Since 2008, as Figure 1 reveals, the total value of the top 15 manufactured exports have been showing an increasing improvement. Exports of these commodities increased from $5.94 billion in 2008 to $8.85 billion in 2011. This figure naturally decreased in the aftermath of the 2011 revolution, a period through which the country went through political and economic unrest, reaching $6.53 billion to rise in 2016 to $8.79 billion and spike to its record high in 2019 to $8.98 billion.
In addition to the change in exports’ growth rates, there has been a change in exports trade flow as well. In 2008, Iron and steel topped the exports’ list with $1.15 billion, followed by plastics with $809 million, chemicals with $777 million, then electrical appliances, copper and articles thereof, and iron and steel sheets respectively. In 2019, however, natural pearls and gold exports (mostly gold exports) replaced iron and steel topping the exports list with total exports of $2048 million, followed by electrical appliances with $1.7 billion, Iron and steel with $694 million, and paper and paperboard with $519 million.
Among the top 15 manufactured exports, pearls and gold exports showed the highest growth rate increasing from $17 million in 2008 to $2.04 billion in 2019 whereas iron and steel exports experienced the greatest decline losing 59 percent of their export value and declining from $1.5 billion in 2008 to $694 million in 2019. Copper and articles thereof suffered a decline as well going down to $182 million form $629 million.
Based on these export trends, the following points could be noted:
- Egypt’s labor-intensive exports, particularly metallurgical exports (copper and iron), has been characterized by low competitiveness. In the pre-2011 era, the metallurgical sector was heavily dependent of subsidized fuel – a crucial production factor – and with the gradual transition to “no subsidies” and the introduction of political and economic changes, the sector suffered dramatic declines.
- Exports of electrical appliances, one of Egypt’s high- complexity exports, peaked at $1.94 billion in 2014 then declined in 2016 losing $400 million of their value to rise again in 2019 at $1.7 billion without making a full recovery.
Second: Egypt’s industrial exports’ major markets
Markets of countries that Egypt has signed free trade agreements with come as the major export markets for Egypt’s manufactured exports. In fact, Egypt has signed a total of 30 bilateral and multilateral trade agreements with countries including Sudan, Australia, Japan, New Zealand, South Korea, Libya, Syria, Palestine, among others. Figure 2 illustrates the largest markets for Egyptian commodities.
Figure 2: Major markets for Egyptian goods
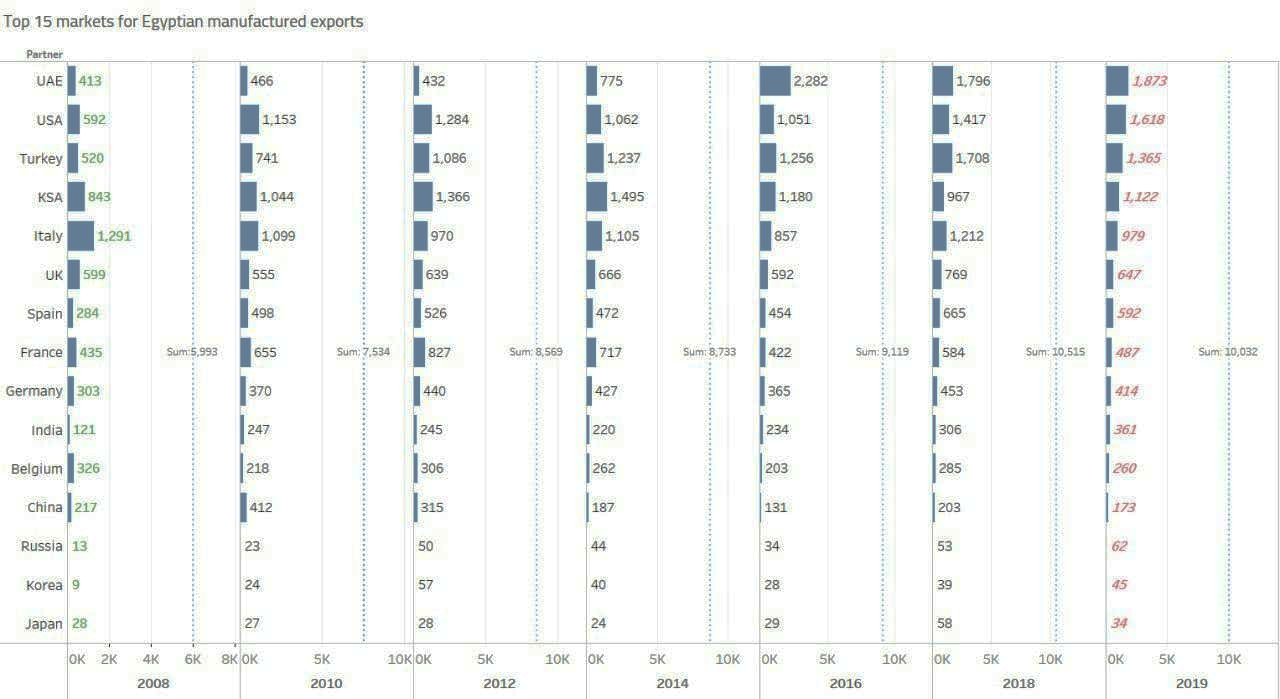
As shown in Figure 2, except for China, Ukraine, Russia, and Brazil (the latter is a party in the MEROSUR agreement Egypt signed last year), all the top 15 markets for Egyptian goods are of countries Egypt has entered into regional conventions with. Exports to these markets are worth $6.3 billion with Italy coming as top importer of Egyptian goods in 2008 with exports totaling $1.29 billion, followed by Saudi Arabia at $0.84 billion, the UK at $0.59 billion, and the US in the fifth place.
In 2019, the exports map changed giving rise to exports totalling $10.03 billion and brining the UAE to the top of importers’ list with an import value of $1.87 billion, followed by the US with $1.61 billion, Turkey with $1.36 billion, the KSA with $1.21 billion, and Italy in the fifth place with $0.97 billion. The UAE was the largest growing market for Egyptian manufactured goods with total exports growing from $413 million to $1.87 billion. This landscape provides some interesting points:
- The exponential growth in exports to the UAE markets can be ascribed to the increase in gold and pearls exports, which stood at about $1.38 billion in 2019, down from $1.6 billion in 2016. Generally, the rise in gold prices is usually accompanied by relative stability in gold exports, which went up from $119.8 million in 2008 to $183 million in 2019.
- Apparel and their accessories are Egypt’s main exports to the US market. The QIZ agreement, which enables unlimited duty free export of Egyptian goods to the USA market if they include at least 11 percent of Israeli inputs out of the appraised value contributed to this increase in textile exports to the US.
- During the period 2008-2019, fertilizers exports to Turkey increased from $13.3 million to $199 million in 2019, an increase that brought Turkey as a top fertilizers’ importer replacing France that was Egypt’s main importer of fertilizers till 2014, with total exports reaching $374 million of total fertilizers’ exports worth of $741 million, whereas it plummeted to $129 million in 2019 of total fertilizers’ exports worth $1.33, following the fall in natural gas production in 2014 before self-sufficiency of gas was restored end of 2018 after new excavations.
- The KSA is the main market for Egyptian iron and steel, with total exports of $205 million in 2019. The KSA has been the only large market that maintained its imports of Egyptian iron and steel even after the liberalization of energy prices. In the period from 2016 to 2018, there has been an increase in iron and steel exports to Spain, USA, Italy, and Turkey. Figure 3 displays the top 15 markets for Egyptian manufactured exports and their share of each commodity.
Figure 3: Top 15 markets for Egyptian manufactured exports and markets’ share of each commodity
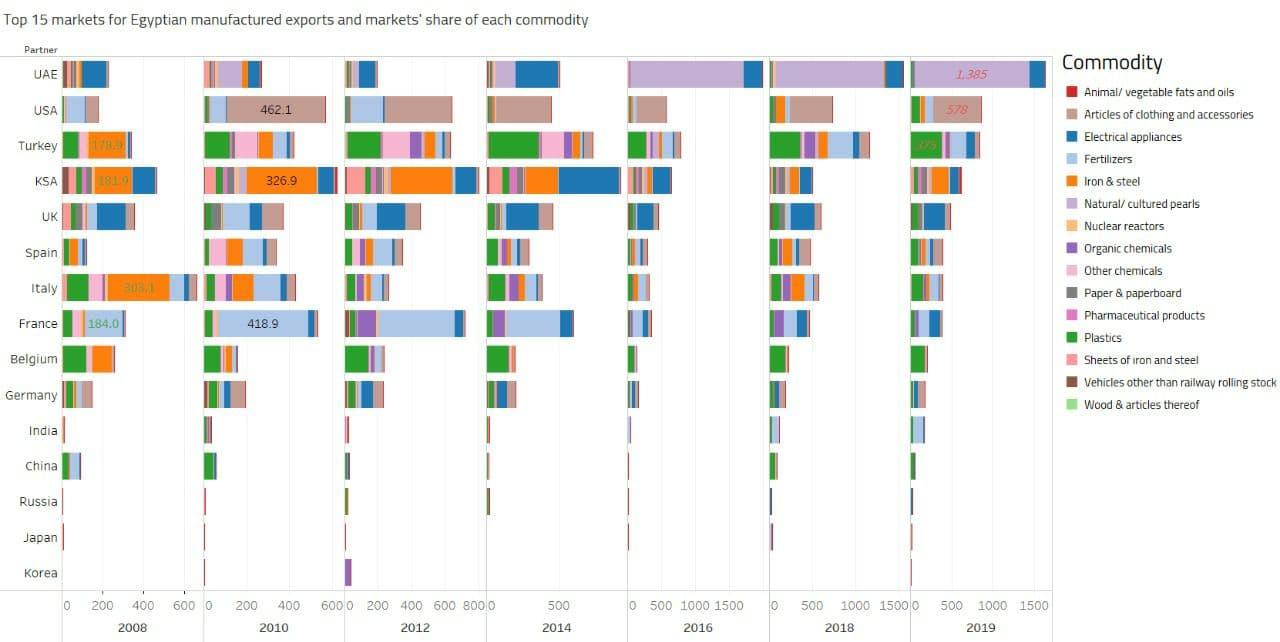
As illustrated in the above figure, fluctuations and fall in Egyptian exports in most markets reflects their inability to maintain their position in export markets or increase their market share. For example, Egypt’s plastic exports to China in 2008 stood at $35 million relative to $45 million in 2019, despite reaching $75 million in 2018. This variation in growth rates isn’t understandable requiring an explanation as to why the exports decreased after showing an increase in a prior period. The same behavior is true of pharmaceutical exports to Turkey which stood at $4.8 million in 2008, to reach $10 million in 2019.
Indeed, this variation could be attributed to the so-called “market penetration” which refers to the sales volume for goods or services in foreign markets that produce or export the same goods and services i.e. competitiveness of Egyptian exports in markets of other producers or competitors e.g. selling Egyptian textiles in Turkey, or chemicals in Saudi Arabia, etc. In practice, Egyptian exports has a low market penetration rate, both in developed or developing countries. The below figure provides a comparison between selected countries by index of market penetration.
Figure 4: Index of market penetration for some selected countries
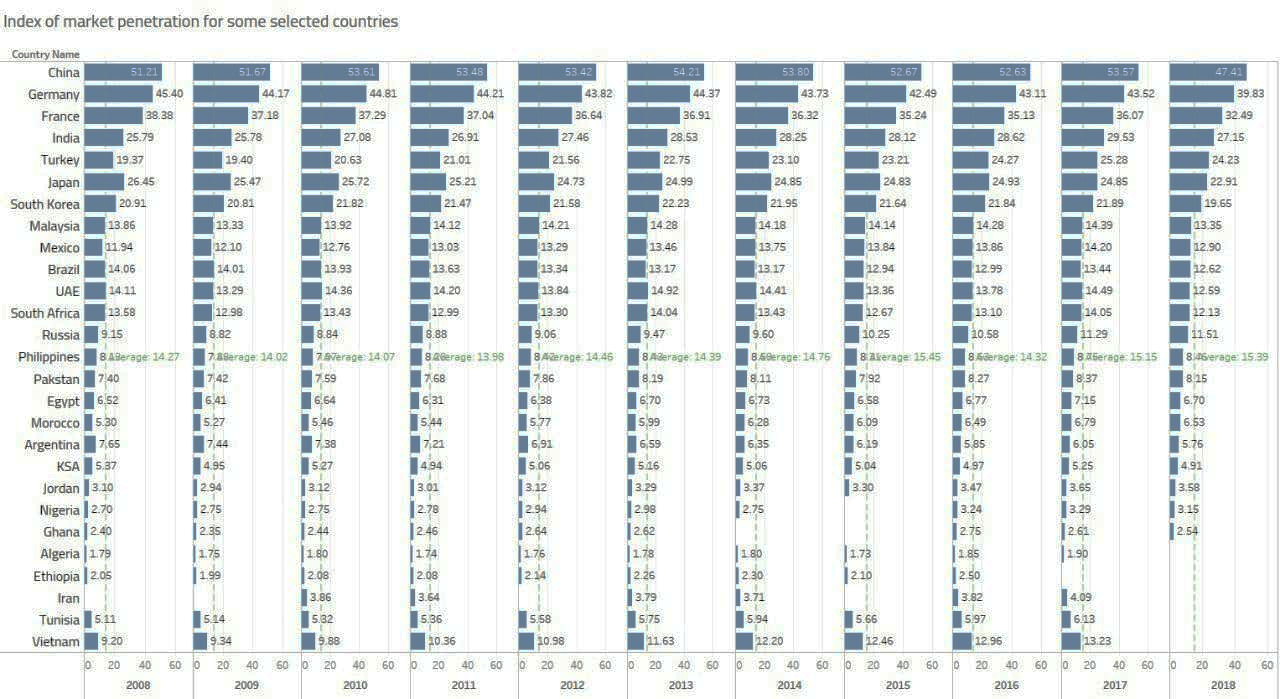
The above figure shows that the market penetration rate for Egyptian exports ranges between 6.5 and 7 percent, while other countries had an average a rate ranging between 14 and 15 percent. This is a significant indicator of the low capabilities and competitiveness of Egypt’s exports compared to exports of emerging markets including Turkey, Malaysia, the Philippines, and Vietnam, among others.
Also, it is noted that the Egyptian exports fall mainly within industries whose global share of exports is declining and worse Egypt’s growth rates within these sectors are low compared to global rates which amounted to five percent in 2015-2019. Of Egypt’s top 15 industrial exports, only iron and steel exports fall within the growth sector while the rest is either declining in developing sectors or growing in declining sectors.
To sum up, the chips are down for Egyptian industrial exports either in relation to their low-technology nature or incapacity to maintain a market share and penetrate markets. Mostly, this could be attributed to the competitive advantage being dependent on both local resources that are being exported at low prices and benefiting from different forms of subsidies, on fuel or exports. Even for exports that showed an increase such has been the case with gold, precious stones, and fertilizers, this has been primarily ascribed to availability of natural resources. Overall, this reflects the limited capacity of Egyptian industries to offer a real value at reasonable prices, a challenge that stands in the way of growth in Egyptian products’ market penetration rate.