


Despite the many undesirable events that unfolded last year and were meant to disrupt the flow in the Suez Canal, the Suez Canal managed to hit record highs, achieving the highest annual revenue in its history and the largest net tonnage.
This came at a time the global shipping sector experienced an unprecedented crisis, resulting in a two-fold or four-fold rise in the cost of shipping compared to the previous year, with vessels queuing near ports, waiting for loading and unloading and the suspension of the activity of many shipping companies due to Covid-19.
Performance Indicators in 2021
The Suez Canal is one of the most vital shipping lanes connecting Europe and Asia and a main source of foreign currency for Egypt. It employs 14,000 Egyptian workers and indirectly provides many jobs across several sectors. The Suez Canal was commended by BIMCO, one of the world’s largest international shipping associations, for its outstanding performance despite repercussions of Covid-19 on global trade and the maritime industry.
In 2021, the canal’s revenues increased by 12.8 percent on a year-to-year basis, recording $6.3 billion relative to $5.6 billion in 2020. As for traffic, 20,694 vessels traversed the Suez Canal in 2021, up from 18,830 in the preceding year, i.e. a 10 percent annual increase and the net tonnages amounted to 1.27 billion tons, up from 1.17 billion tons in 2020.
Additionally, the Suez Canal acquired about 15.7 percent of the total global seaborne grain trade, with a total cargo of 83.5 million tons, and recorded a significant increase in the traffic rates of various types of ships compared to 2020, as shown in the below figure.
Figure 1: Traffic in the Suez Canal by ship type

As is shown in the previous figure, there has been a rise in the number of LNG ships transiting the Canal by 36.6 percent, rising from 686 ships in 2020 to 937 ships in 2021. Container ships passing through the canal increased by 10.1 percent, with 5,186 container ships, up from 4,710 in 2020. Bulk carriers, on the other hand, increased by 15.3 percent, growing from 5,113 ships in 2020 to 5893 ships in 2021. As regards the quarterly traffic of ships passing through the Suez Canal, the number of ships transiting the canal in the first quarter of the 2021-2022 hit record highs at 5410 ships, up from 5,182 during the fourth quarter of 2020-2021, i.e. a quarterly increase of 4.39 percent, as indicated in the following figure:
Figure 2: Quarterly number of ships traversing the Suez Canal

Turning to the net tonnage transported through the Suez Canal, we find that the net tonnage during the first quarter of 2021-2022 (July, August, and September 2021) amounted to 327.6 million tons, compared to 318.4 million tons in the fourth quarter of 2020-2021, an annual increase of about 2.8 percent as shown in the figure below:
Figure 3: Net tonnage of ships transiting the Suez Canal (million tons)

As an inevitable consequence of that, transit charges from the Suez Canal increased by about 7.5 percent during the fourth quarter of 2020-2021, recording $1.56 billion, compared to $1.45 and $1.34 billion in third quarter of 2020-2021 and the fourth quarter of 2019-2020, as is shown in Figure (4).
Figure 4: Suez Canal transit charges (billion dollars)

The previous charts reveal the solid performance of the Suez Canal over the past year in terms of traffic fees, the number of transiting ships, and the net tonnage. This positive development can be attributed to several drivers, which we detail below.
Various Drivers
There are several factors that helped the Suez Canal record high growth rates last year, ranging from external factors arising from the situation of the global economy and internal factors arising from the development of new marketing plans and policies. Below, we review the most significant of these drivers.
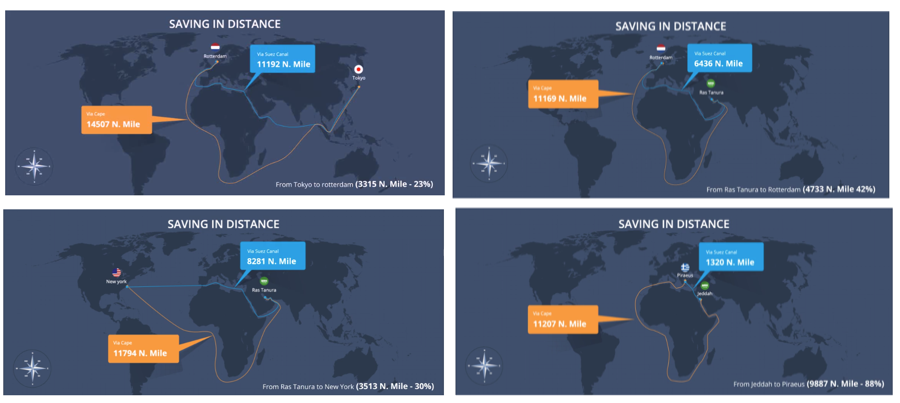
1. Rising Oil Prices: The rise in oil prices in 2021 to higher levels than those recorded before the pandemic contributed to increasing the competitive advantage of the Suez Canal. The higher oil prices are, the higher the cost of alternative and competitive routes is, particularly the Cape of Good Hope route, a scenario that causes ships to choose the shorter, least costly, and least fuel-consuming route. Compared to other routes, the geographical location of the Suez Canal makes it the shortest route between the east and the west. As such, ships transiting the Canal achieve savings in distance, which would mean savings in time, fuel consumption, and ship operating costs. The following Table shows savings in sailing distance from ports in the Arabian Gulf and Asia to ports in Europe and the United States.
Table 1: Savings in sailing distance for ships transiting from ports in the Arabian Gulf and Asia to ports in Europe and the United States
| From | To | Distance (Nautical Mile( | Saving in Sailing Distance | ||
| Suez Canal | Cape of Good Hope | Nautical Mile | % | ||
| Ras Tanura | Constanta | 4144 | 12094 | 7950 | 66 |
| La Vera | 4684 | 10783 | 6099 | 57 | |
| Rotterdam | 6436 | 11169 | 4733 | 42 | |
| New York | 8281 | 11794 | 3513 | 30 | |
| Jeddah | Piraeus | 1316 | 11207 | 9891 | 88 |
| Rotterdam | 3997 | 10797 | 6800 | 63 | |
| Tokyo | Rotterdam | 11192 | 14507 | 3315 | 23 |
| Singapore | Rotterdam | 8288 | 11755 | 3467 | 29 |
The following illustrative maps show the distance difference between the Suez Canal and the Cape of Good Hope for a number of selected ports, which gives the Suez Canal a competitive advantage amid surges in oil prices.
2. Marketing Efforts: The SCA pursued flexible marketing and pricing policies that helped it win the confidence of the maritime community and flexibly deal with the changing landscape of the maritime industry amid challenges of Covid-19, which enabled the Canal to record the highest vessel attraction rates at 4,920 ships and the highest revenue from marketing policies since the operation of the Canal, accounting for about $1.1 billion of the Canal’s total revenues in 2021. Overall, the marketing efforts played a crucial role in increasing the number of ships passing through the canal, hitting record highs of 1532 ships, generating a revenue of $597.6 million.
3. Environmental Initiatives: The Suez Canal Authority (SCA) plans to adopt new working mechanisms and regulations by operationalizing an environmental initiative called the “Green Canal” to promote environmental conservation in line with the directions of the International Maritime Organization (IMO) with the aim of reducing carbon emissions through the adoption of some new measures, e.g. examining the feasibility of providing incentives for environment-friendly ships and ways to use renewable energy in operating monitoring stations and a number of marine units, which would qualify the Suez Canal to declare itself a “Green Canal.”
Accordingly, the SCA is considering granting fee discounts of between 10-20 percent to ships adhering to the environmental regulations in shipping. Additionally, the SCA has also started implementing its plan aimed at making the transition to solar and wind energy as sources for generating electricity and operating monitoring stations on the waterway.
4. Successful Resolution of the Ever Given Crisis: The SCA has been commended by the international community after it successfully dealt with the Ever Given’s stranding crisis that disrupted the flow of global trade and caused suspension of navigation in the Canal and the backlog of 400 ships before the Canal’s rescue teams managed, with international support, to re-float it safely without any damage to the hull or the cargo onboard
In short, the Suez Canal performance in 2021 exceeded expectations due to the oil consumption, time, and operating advantages it offers ships, which led vessels to use the Suez Canal instead of the Cape of Good Hope, as well as the SCA’s implementation of many logistical projects that serve ships and marine navigation despite the crisis in the maritime transport sector.